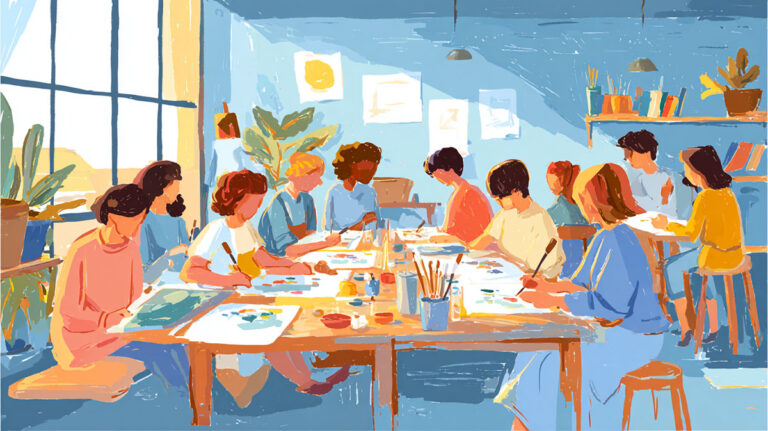
Most people support arts education. Far fewer realize how unevenly it’s actually distributed – or what the data shows when students lose access to it.
Art education statistics tell a story that goes well beyond school budgets and curriculum debates. They reveal measurable differences in graduation rates, college enrollment, standardized test scores, and long-term career outcomes – especially for students from low-income backgrounds.
The research base is substantial. Decades of longitudinal studies, national surveys from the NEA and NCES, and large-scale district-level data now give us a detailed picture of K-12 arts access and its real-world impact on student achievement.
This article pulls that evidence together in one place.
You’ll find data covering arts program availability by discipline and region, funding trends, equity gaps across income and race, outcomes for at-risk youth, and what Americans think about the state of arts learning in public schools.
Academic Performance & Student Achievement
- Students engaged in arts learning outperform their peers academically, with a 4.4 GPA point increase. (ZipDo Education Reports, 2025)
- Arts-rich schools report 15% higher scores on standardized tests compared to schools with less arts integration. (ZipDo Education Reports, 2025)
- Students in arts-focused schools score higher on reading and mathematics assessments than their peers by an average of 23 percentile points. (ZipDo Education Reports, 2025)
- Schools with comprehensive arts education programs see a 25% increase in students’ standardized test scores. (ZipDo Education Reports, 2025)
- Students who participated in at least two semester-length arts workshops saw their language grades increase by 0.61 standard deviations, math grades by 0.36, and art grades by 0.33. (npj Science of Learning / PubMed Central, 2023)
- Arts learning improves writing test scores by 13% of a standard deviation. Effects are especially strong for English language learners, whose writing scores improve by 27% of a standard deviation. (Education Next / Houston ISD study)
- At schools with expanded arts education, students are 20.7% less likely to have a disciplinary infraction. (Education Next)
- School engagement increases by 8% of a standard deviation in schools with expanded arts access. (Education Next)
- Students’ emotional empathy increases by 7.2% and cognitive empathy by 3.9% of a standard deviation in arts-enriched programs. (Education Next)
- High school participation in extracurricular arts activities is generally associated with positive outcomes including higher math scores, better high school GPAs, higher graduation rates, and higher college GPAs. (National Endowment for the Arts, 2025)
- Completion of fine arts credits in high school is linked to higher cumulative GPAs across all core content areas: English Language Arts, Math, Science, and Social Studies. (National Endowment for the Arts, 2025)
- Preschool-age children who consistently participated in any type of arts activity had higher scores on academic assessments in reading, math, and language than children not engaged in those activities. (National Endowment for the Arts, 2025)
- At-home arts engagement of toddlers, preschoolers, and kindergarteners was positively correlated with a variety of social-emotional attributes and cognitive outcomes. (National Endowment for the Arts, 2025)
- From kindergarten through fifth grade, taking arts classes outside school was positively linked to reading, math, and science scores. (National Endowment for the Arts / NCES, 2025)
- Arts students had a 63.8% rate of earning mostly A grades, compared to 43.7% among non-arts students. (National Endowment for the Arts, cited by IPaintMyMind)
- The number of fine arts credits completed was associated with a far higher likelihood of obtaining a high school diploma or equivalent. (National Endowment for the Arts / NCES School Pulse Panel, 2025)
- Among students who pursued higher education, there was a positive relationship between the number of arts credits taken in high school and first-year college GPA. (National Endowment for the Arts, 2025)
Arts Discipline Access in U.S. Public Schools
Not all art forms get equal space in the school day. Music and visual arts dominate. Dance and theater are a different story entirely – available in a fraction of schools, often dependent on school size, location, and funding. The data below breaks down exactly how access varies across disciplines, school types, and regions.
Standalone Class Availability by Arts Discipline
Based on the November 2024 NCES School Pulse Panel Survey – the first comprehensive national snapshot of its kind in over a decade – here’s how often each discipline is actually offered as a standalone class during the regular school day.
Dance went from being offered in 20% of schools during the 1999–2000 school year down to 3% by 2009–10 – and now sits at 13% nationally per the 2024 data. It’s recovering, but slowly. Rural schools are especially far behind: only 7% of rural schools offer dance, versus 20% in cities. (Source: NCES School Pulse Panel, 2024; University of Nebraska-Lincoln Digital Commons)
Arts Class Requirements by School Type and Region
73% of public schools that offer standalone arts classes require students to take at least one. But that number shifts significantly depending on where the school is and what grade level it serves.
Visual Arts Class Access by U.S. Region (8th Grade)
The regional gap in visual arts access is one of the starkest data points in arts education. Students in the South and West are dramatically less likely to take a visual arts class than their peers in the Northeast.
Students in the Northeast are almost exactly twice as likely to take a visual arts class as students in the South or West. That’s not a small gap. It reflects decades of uneven state policy, funding, and accountability – the arts aren’t tested, so in states with high-stakes testing pressure, they tend to get dropped first.
Graduation, College Enrollment & At-Risk Youth
- Students with four years of arts or music education in high school have a graduation rate of 90.2%, compared to 72.9% for students without that exposure. (U.S. Department of Education)
- Students from low-income backgrounds who had arts-rich instruction in school were:
- 5x less likely to drop out of school
- 10% more likely to take a calculus course
- 4x more likely to earn a bachelor’s degree
- 30% more likely to pursue a professional career (National Endowment for the Arts, 2012 – cited by Create CA)
- Engagement in arts education has been linked to a 27% higher likelihood of college attendance among high school students. (ZipDo Education Reports, 2025)
- Arts education contributes to lower dropout rates, with a reduction of 15% in schools with active arts programs. (ZipDo Education Reports, 2025)
- At-risk teenagers with a history of intensive arts experiences show achievement levels closer to – and in some cases exceeding – the levels shown by the general population. (National Endowment for the Arts / Catterall et al.)
- Of all students in the Add Health study (n=12,232), 77.83% graduated high school with at least one arts course on their transcript. (National Endowment for the Arts research / University of Texas Population Research Center)
What Americans Actually Think About Arts Education
Public support for arts education is strong – and has been for years. But support doesn’t automatically translate into funding, access, or action. The data below comes from large-scale national surveys and reveals a clear tension: most Americans think arts education matters, but far fewer believe students are actually getting enough of it.
Key Opinion Data at a Glance
The 2023 Americans Speak Out About the Arts survey (n=3,062 adults, conducted by Ipsos Public Affairs for Americans for the Arts) is one of the most detailed public opinion studies on arts and culture to date. Combined with data from other national polls, here’s where Americans actually stand.
There’s a real disconnect here. 92% of Americans say every student should get a quality arts education. Only 52% think students are actually getting enough access to art classes. That 40-point gap between belief and perceived reality is worth paying attention to.
Support for Government Funding of Arts Education
Political divides around education funding are real – but when it comes to the arts specifically, support crosses party lines more than people might expect. The 2023 survey data shows broad backing for government investment at every level.
Participation in Arts & Cultural Events
Arts engagement in everyday American life is higher than the budget conversation might suggest. Nearly 80% of Americans attended, visited, or watched an arts or culture event in person in the past year – which makes the funding and access gaps even harder to ignore.
The decline in formal arts lesson participation across all disciplines – down over three decades – tracks directly with the decline in school-based arts programs. Childhood access to arts education is, according to the NEA, the single most significant predictor of arts participation in adult life. When schools cut these programs, the effects don’t stop at graduation. (Source: NEA Survey of Public Participation in the Arts, cited by Americans for the Arts)
Social-Emotional & Mental Health Benefits
- Research involving more than 200 studies over six decades found widespread evidence that arts education contributes to children’s and adolescents’ social-emotional development. (UChicago Consortium on School Research / Ingenuity)
- A 2016 study found that 45 minutes of making art significantly lowers cortisol (the stress hormone) levels. (Kaimal, Ray & Muniz – cited by ASCD)
- Arts engagement, including music therapy and dance, can reduce anxiety and depression symptoms in children and adolescents. (WHO / NCBI Bookshelf)
- In adults with a mental illness, activities like choir singing, art-making, expressive writing, and group drumming reduce mental distress while enhancing individual and social well-being. (WHO Evidence Review / NCBI Bookshelf)
- Approximately 80% of American art teachers report that their students experience increased emotional well-being through art education. (ZipDo Education Reports, 2025)
- Students involved in arts programs show a 17% increase in peer cooperation scores. (ZipDo Education Reports, 2025)
- Arts education improves students’ ability to think creatively, with 60% reporting enhanced creativity. (ZipDo Education Reports, 2025)
- Fine arts education positively and significantly influences psychological well-being among undergraduate students. (Frontiers in Psychology / PubMed Central, 2022)
- The NEA reports that from early childhood through adolescence, arts education helps students better cope with their feelings, show resilience, and demonstrate tolerance and compassion for others. (National Endowment for the Arts)
- In arts program reviews from the criminal justice context, arts programs for juvenile offenders showed improvements in academic performance, social skills, stress management, and reduced reoffending rates. (WHO Evidence Review / NCBI Bookshelf)
Arts Education and At-Risk Youth Outcomes
The research on arts education and at-risk youth is some of the most compelling in the field. The NEA’s landmark longitudinal study tracked more than 22,000 students over 12 years and found that arts engagement produces measurable differences in graduation rates, college enrollment, career aspirations, and civic participation – particularly for students from low-income backgrounds.
The comparison below draws on that study and related research to show what changes – and by how much – when low-socioeconomic-status students have sustained access to arts education.
Low-SES Students: High Arts Engagement vs. Low Arts Engagement
After tracking more than 22,000 students for 12 years, NEA researchers found that students with high arts involvement were five times more likely to graduate high school than those with low involvement. That figure alone should carry more weight in budget conversations than it currently does. (Source: National Dropout Prevention Center / NEA)
What Arts Education Does for At-Risk Students Specifically
These figures come from the NEA’s 2012 study on at-risk youth – students in the lowest socioeconomic quartile – comparing those with arts-rich backgrounds to peers with minimal arts exposure.
Arts Education Access & Availability
- 73% of all public schools impose arts education requirements (for schools offering standalone arts classes). The rate drops to 70% for schools in the highest-poverty areas, versus 74% in lower-poverty areas. (National Center for Education Statistics / NEA, 2025)
- Schools in low-poverty areas: 87% offer standalone music classes and 84% offer standalone visual arts classes. Schools in high-poverty areas: only 72% and 73%, respectively. (National Center for Education Statistics / NEA, 2025)
- As of 2020, only 19 states included the arts as a key education area. (University of Wisconsin-Madison, cited by Truthout, 2024)
- In the 2009–10 school year, only 3% of schools allocated funds for dance classes and only 4% for theater, down from 20% for both during the 1999–2000 school year. (University of Nebraska-Lincoln Digital Commons)
- The Arts Education Data Project is currently working in 31 states to increase arts participation, with the goal of providing data in all 50 states. (Arts Education Data Project)
- In Ohio, since 2006, school-based arts education participation increased from 65% to 80% of all students, and the number of students without access declined from more than 75,000 to just over 3,000. (Arts Education Data Project)
- In 2019, the National Arts Education Data Project projected there were more than 2 million students nationwide who lacked access to arts education – and that was before the COVID-19 pandemic. (National Arts Education Data Project, cited by Word in Black)
- Overall, 63% of eighth-graders took a music class and 42% took a visual arts class in recent assessments. (National Assessment of Educational Progress / NAEP)
- Students in the Northeast were twice as likely (68%) to have taken a visual arts class compared to students in the South (35%) and West (33%). (NAEP, cited by Education Writers Association)
Equity & Access Disparities
- Low-income students (eligible for free/reduced-price lunch) scored an average of 26 points lower in music and 22 points lower in visual arts on a 300-point NAEP scale, compared to higher-income peers. (National Assessment of Educational Progress / NAEP)
- Black students scored 29 points lower in music and 30 points lower in visual arts than white students on the NAEP scale. (National Assessment of Educational Progress / NAEP)
- Only 17% of higher-income students reported taking private music lessons outside school, compared to 9% of lower-income students. (National Assessment of Educational Progress / NAEP)
- 55% of higher-income students own a musical instrument, compared to 38% of low-income students. (National Assessment of Educational Progress / NAEP)
- 84% of arts and design alumni in the U.S. who responded to the SNAAP survey are White Non-Hispanic, reflecting deep racial underrepresentation in arts higher education. (Strategic National Arts Alumni Project / SNAAP)
- Female arts alumni earn 41% less than their male counterparts, even after accounting for graduate degrees, skill acquisition, marital status, and other factors. (Strategic National Arts Alumni Project / SNAAP)
- Schools with the highest concentrations of students of color are 4 times as likely to employ an uncertified teacher compared to schools with the lowest concentrations. (Learning Policy Institute, 2025)
- Black students are twice as likely as white peers to be in inadequately funded school districts and 3.5 times more likely to be in chronically underfunded districts. (Albert Shanker Institute, 2024)
- Only 20% of the current teaching workforce are teachers of color, despite over half of all students being people of color. (Devlin Peck, citing multiple sources, 2025)
- Inexperienced teachers hired on emergency-style permits are 3 times more likely to teach in schools with higher populations of Black, Latino, and racially diverse students. (Children Now, cited by Word in Black)
Arts Education and Standardized Test Scores
The relationship between arts study and SAT performance has been tracked by the College Board since 1987 – one of the longest-running datasets in arts education research. The pattern is consistent: the more years of arts coursework a student completes, the higher their scores tend to be, across both verbal and math sections.
Worth noting: this is correlational data, not causal. Students who choose arts classes may already be higher performers, or may attend schools strong in both academics and the arts. That said, the gap is large enough – and consistent enough across years – that it’s hard to dismiss.
SAT Score Gap by Years of Arts Study
Arts Education and Broader Academic Performance
SAT scores are only part of the picture. The data below pulls together how arts participation connects to academic performance across a wider range of measures – grades, assessments, writing, and school engagement.
The writing score improvement for English language learners stands out in particular – a 27% standard deviation gain is well above what most academic interventions produce. For students who already face language barriers, arts education appears to offer an entry point into written expression that conventional instruction often misses. (Source: Education Next / Houston ISD causal study)
Funding & Budget Cuts
- The FY 2026 federal budget proposal includes a $4.535 billion cut to K-12 education funding. The proposal eliminates all funding for both the National Endowment for the Arts (NEA) and the National Endowment for the Humanities (NEH). (Educational Theatre Association / Where Creativity Works, citing Trump Administration FY 2026 Budget, May 2025)
- The overall FY 2026 budget proposal cuts non-defense discretionary funding by $163 billion, including a $12 billion (15.3%) reduction to the U.S. Department of Education. (National Association for Music Education / NAfME, June 2025)
- The FY 2026 proposal would consolidate 18 competitive and formula grant programs – currently funded at more than $6 billion annually – into a new $2 billion formula grant, eliminating dedicated arts education programs including the Assistance for Arts Education program and Title IV-A. (National Association for Music Education / NAfME, June 2025)
- The NEA already canceled more than $27 million in grants, including many for arts education, in 2025. (Boston Tutoring Services, 2025)
- The NEA’s most recent fiscal report showed a total budget of $207 million, with $163 million distributed in grants. (Boston Tutoring Services, 2025)
- In Florida, Governor Ron DeSantis vetoed the state’s entire $32 million arts budget in 2024, affecting more than 600 arts organizations. (Glasstire, 2024)
- Budget allocations for arts education in public schools declined by 12% from 2010 to 2020, leading to fewer program offerings. (ZipDo Education Reports, 2025)
- Funding cuts to arts education have increased by 15% over the past decade, impacting more than 1 million students. (ZipDo Education Reports, 2025)
- About 55% of school districts (around 7,000 of the existing 12,546) have either cut or significantly decreased arts funding. (The Cub, citing national data, 2024)
- After adjusting for inflation, state-level art funding throughout the years has decreased 43.4% since the 1960s. (National Assembly of State Arts Agencies / NASAA, 2019 fiscal year report – cited by Pepperdine Graphic)
- In Los Angeles Unified School District, one-third of the district’s 345 arts teachers were let go between 2008 and 2012, and arts offerings for half of K–5 students were reduced to zero. (Boston Tutoring Services, 2025)
- The $200 billion American Rescue Plan (2021) temporarily expanded arts programming in public schools; all funds were required to be spent by the end of December 2024. (Truthout, 2024)
Arts Discipline Availability in U.S. Elementary Schools Over Time

What the data shows
This chart tracks the percentage of U.S. public elementary schools offering standalone instruction in each of the four major arts disciplines across three data points.
The stable disciplines:
- Music held at 94% from 1999 to 2009, then dipped to 84% by 2024
- Visual arts dropped slightly from 87% to 83%, and sits at 82% today
The collapsed disciplines:
- Drama/theater fell from 20% to just 4% between 1999 and 2009 – an 80% drop – before partially recovering to 26% by the 2024 survey
- Dance saw the same cliff: 20% to 3% over the same decade, and has only recovered to 13%
Why the dip happened
The sharp 2009 drop in dance and theater coincides directly with the No Child Left Behind era (2002–2015), when districts under pressure from standardized testing cut non-tested subjects first. Music and visual arts held because of stronger institutional support, specialist teachers, and parental expectations.
Key takeaways
- The 2009 numbers for dance and theater represent a near-complete collapse of those programs at the elementary level
- Even with partial recovery by 2024, dance is still available in only 1 in 8 schools
- The gap between music (84%) and dance (13%) is not small – it represents decades of unequal institutional investment
Sources: National Center for Education Statistics, Arts Education in Public Elementary and Secondary Schools: 1999–2000 and 2009–10 (NCES 2012-014); NCES School Pulse Panel Survey, November 2024; Albert Shanker Institute.
Teacher Shortage & Workforce
- In the 2024–25 school year, an estimated 365,967 teachers were not fully certified for their teaching assignments, and an additional 45,582 positions remained unfilled – a total of at least 411,549 impacted teaching positions, representing about 1 in 8 of all teaching positions nationally. (Learning Policy Institute, 2025)
- This total represents an increase of approximately 4,600 positions compared to the 2024 scan. (Learning Policy Institute, 2025)
- 74% of school districts reported difficulty filling open teaching positions for the 2024–25 school year. (We Are Teachers, citing School Pulse Panel, 2025)
- 86% of public schools struggle to hire educators. (Teachers of Tomorrow, 2025)
- The top two challenges schools reported when filling teaching vacancies: lack of qualified candidates (64%) and too few candidates applying (62%). (National Center for Education Statistics / School Pulse Panel, October 2024)
- Only 18% of Americans would encourage young people to become K–12 teachers. (NORC at the University of Chicago, cited by Teachers of Tomorrow)
- Only 30% of teachers consider teaching rewarding, and just 19% think it’s a sustainable career choice. (We Are Teachers, 2025)
- On average, teachers make 26.4% less per year than other professionals with similar education. (Economic Policy Institute, cited by College Transitions)
- Teacher salaries have increased just $29 per week in the last 28 years, adjusted for inflation. (Economic Policy Institute, cited by College Transitions)
- 94% of teachers spend their own money on classroom supplies. (NEA, cited by College Transitions)
- Teacher turnover in a sample of eight states jumped to 14–16% in 2023–24, about 2 percentage points higher than pre-pandemic levels. (Teachers of Tomorrow, 2025)
- More than 40% of schools report having to hire underqualified teachers, nearly 30% have increased class sizes, and 25% have cut course offerings due to staffing shortages. (Teachers of Tomorrow, 2025)
The Outcomes Gap: Arts Engagement Among Low-SES Students

What this chart measures
This chart compares five key life outcomes for students from the lowest socioeconomic quartile, split by level of arts engagement. All data comes from the NEA’s longitudinal study that tracked more than 22,000 students over 12 years.
The gaps, broken down
High school graduation:
- High-arts, low-SES students: 90.2% graduation rate
- Low-arts, low-SES students: 72.9% – a gap of more than 17 percentage points
College and career aspirations:
- 74% of high-arts 8th graders planned to earn a bachelor’s degree, versus 43% of low-arts peers
- 30% of high-arts college students chose a professional career track, versus just 14% of low-arts peers
Long-term career expectations:
- Half of high-arts low-SES adults expected to work in a professional career (law, medicine, education, management)
- Among low-arts low-SES adults, that figure was 21% – less than half
What makes this data different
Most arts education research tracks average outcomes. This dataset focuses specifically on the students most likely to be affected by cuts – those already at a socioeconomic disadvantage. The gaps here are not marginal. Across every metric, arts engagement is associated with meaningfully better outcomes for the students who arguably need those outcomes most.
Sources: National Endowment for the Arts, The Arts and Achievement in At-Risk Youth: Findings from Four Longitudinal Studies (Catterall, Dumais, and Hampden-Thompson, 2012); U.S. Department of Education; Americans for the Arts.
Arts & the Creative Economy
- The arts and cultural sector contributed a record high to the U.S. economy in 2022, with nominal value added increasing 7.6% nationally in 2023 (not adjusted for inflation). (U.S. Bureau of Economic Analysis / BEA, April 2025)
- Real (inflation-adjusted) value added for core arts and cultural production industries – including fine arts education – increased 5.5% in 2023. (U.S. Bureau of Economic Analysis / BEA, April 2025)
- Creative services exports reached $1.4 trillion in 2022, a 29% increase since 2017. Creative goods exports reached $713 billion, a 19% increase over the same period. (UN Trade and Development / UNCTAD, Creative Economy Outlook 2024)
- The creative economy contributes between 0.5% and 7.3% of GDP in different countries, and employs between 0.5% and 12.5% of the workforce globally. (UNCTAD, Creative Economy Outlook 2024)
- The arts employ 4.9 million workers across the U.S. with total earnings of more than $370 billion. (U.S. Bureau of Economic Analysis / National Endowment for the Arts)
- The arts exported $20 billion more than they imported, providing a positive trade balance. (U.S. Bureau of Economic Analysis / National Endowment for the Arts)
- The California creative economy creates 2.7 million jobs and contributes $174.6 billion to the state’s economy. (Otis College Report on the Creative Economy, cited by Create CA)
- The median annual wage for arts and design occupations was $53,180 in May 2024, compared to the overall median of $49,500 for all occupations. (U.S. Bureau of Labor Statistics, Occupational Outlook Handbook, 2024)
- The median annual wage for craft and fine artists was $56,260 in May 2024. The lowest 10% earned less than $29,120; the highest 10% earned more than $133,220. (U.S. Bureau of Labor Statistics, 2024)
- Overall employment of craft and fine artists is projected to show little or no change from 2024 to 2034, though about 4,400 openings per year are projected on average due to worker replacement. (U.S. Bureau of Labor Statistics, Occupational Outlook Handbook)
- Florida’s arts and cultural industry generated $5.8 billion in economic activity and supports 91,270 full-time jobs, according to a 2022 study. (Americans for the Arts / Division of Arts and Culture, 2022 – cited by Glasstire)
- Streaming services expanded their share of the global music market by 10.4% year-on-year, now accounting for 67.3% of global music revenue. (UNCTAD, Creative Economy Outlook 2024)
Higher Education & Alumni Outcomes
- 92% of doctoral degree earners in arts or design have arts- or design-related duties as a regular part of their employment. This compares to 84% of master’s degree earners and approximately 70% of bachelor’s and associate degree earners. (Strategic National Arts Alumni Project / SNAAP, April 2024)
- The largest skill gap reported by arts and design alumni: ‘business, financial, or entrepreneurial skills’ – 65% said these were important or very important in their work, but only 33% reported acquiring them during their postsecondary education. (Strategic National Arts Alumni Project / SNAAP, April 2024)
- 60% of arts and design alumni in the workforce are ‘very satisfied’ with their degree of independence. (Strategic National Arts Alumni Project / SNAAP, April 2024)
- 85% of employers say that creative problem-solving skills are in high demand for senior-level and high-paying careers. (Adobe’s Get Hired study, cited by Create CA)
- 85% of business leaders are looking for creativity and innovation in candidates. (Americans for the Arts, cited by Create CA)
- According to an IBM poll, for-profit CEOs rank creativity at the top of their lists of important leadership qualities. (IBM / cited by IPaintMyMind and Workforce.org)
- 50% of school districts reported implementing new arts programs or expanding existing ones in the last three years. (ZipDo Education Reports, 2025)
- 85% of alumni from arts programs report improved teamwork and communication skills, citing these as key job readiness skills. (ZipDo Education Reports, 2025)
Public Attitudes Toward Arts Education
- 9 in 10 Americans believe that arts spaces improve quality of life. (Americans for the Arts, 2018)
- 72% of Americans believe that the arts unify their community. (Americans for the Arts, 2018)
- Only 18% of Americans would encourage young people to become K–12 teachers – a figure that reflects broader concern about the state of public education, including arts programs. (NORC at the University of Chicago, cited by Teachers of Tomorrow)
Key Data Notes
- The NCES School Pulse Panel survey (designed in partnership with the NEA) became publicly available in early 2025 and provides new estimates of arts education access in K–12 schools nationwide.
- The NEA launched the National Arts Statistics and Evidence-based Reporting Center (NASERC) on April 2, 2024, providing a new suite of research and data tools on arts and cultural production.
- The Arts Education Data Project works in 31 states as of 2024, aiming to expand to all 50 states, providing near-real-time data on arts course offerings, enrollment, and teacher availability.
Conclusion
The art education statistics covered in this article point to one clear pattern: access matters, and right now, access is not equal.
Students in high-poverty schools, rural districts, and communities of color consistently receive less arts instruction – fewer disciplines, fewer specialists, less time.
That gap has real consequences. The data on graduation rates, SAT scores, college enrollment, and civic engagement all shift meaningfully when students have sustained access to arts programs.
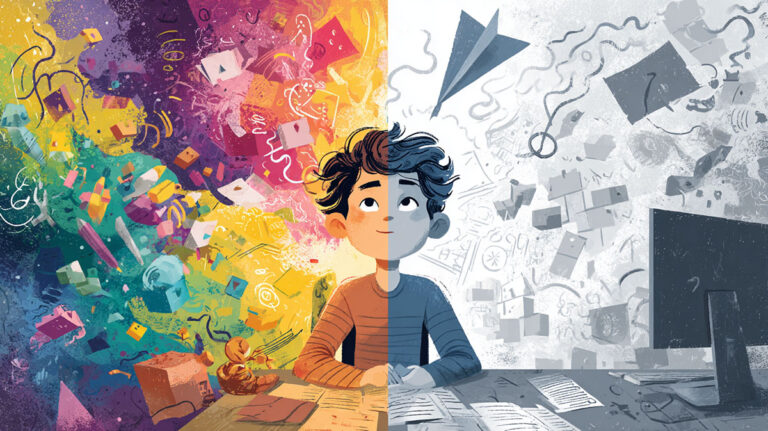
The K-12 arts access conversation is no longer just about creativity. It’s about student achievement, long-term outcomes, and which communities get to benefit from what the research already confirms.
Funding cuts continue. Teacher shortages persist. And the evidence keeps growing.
Whether you’re an educator, a policymaker, or a parent, the case for investing in school arts programs – across every discipline, at every income level – is backed by decades of longitudinal research.
The numbers don’t leave much room for debate. What happens next is a policy choice.