The global art market reached $57.5 billion in 2024, yet most people have no idea what drives these staggering numbers. From Art Basel attendance figures to Sotheby’s auction performance data, art statistics reveal fascinating patterns about collector behavior, market trends, and cultural participation rates.
Understanding art market data isn’t just for investors anymore. Gallery statistics and museum attendance figures show how art consumption patterns affect everything from urban development to digital platform growth.
This comprehensive analysis examines the most compelling art industry metrics shaping today’s cultural landscape. You’ll discover:
- Auction house reports and market valuation statistics
- Collector demographics and art investment returns
- Exhibition analytics from major institutions like the Louvre Museum
- Art fair metrics and gallery performance indicators
Whether you’re an art collector, cultural researcher, or simply curious about the contemporary art data driving billion-dollar decisions, these insights will transform how you view the intersection of culture and commerce.
Global Art Market Size & Value
Market Value & Growth
- Global art market value: $57.5 billion in 2024 (12% decline from 2023)
- Previous year comparison: $65 billion in 2023 (4% decline from 2022)
- Projected market size: $585.98 billion in 2025, reaching $944.59 billion by 2033
- Market growth rate: 6.15% CAGR (2025-2033)
- Transaction volume: 40.5 million transactions in 2024 (3% increase)
Sources: Art Basel & UBS Global Art Market Report 2025, Straits Research
Online Art Market
Digital Sales Performance
- Online art sales 2024: $10.5 billion (11% decline from 2023)
- Online sales 2023: $11.8 billion (7% increase from 2022)
- Online market share: 18% of total art market in 2024
- Comparison to pre-pandemic: 76% above 2019 levels
- Peak online sales: $13.3 billion in 2021
Sources: Art Basel & UBS Global Art Market Report 2025
Top Performing Artists by Auction Revenue 2023-2024
| Artist | Period/Movement | 2023 Revenue | Market Status |
|---|---|---|---|
| Pablo Picasso | Cubism/Modern | $438M | Blue Chip |
| Jean-Michel Basquiat | Neo-Expressionism | $285M | Contemporary |
| Andy Warhol | Pop Art | $256M | Pop Icon |
| Claude Monet | Impressionism | $198M | Impressionist Master |
| Gerhard Richter | Contemporary | $176M | Living Master |
| Yoshitomo Nara | Contemporary/Pop | $145M | Asian Contemporary |
Source: Artprice Global Art Market Reports
Regional Market Performance
United States
- Market share: 43% of global sales (2024)
- Sales value: $24.8 billion in 2024 (9% decline)
- Previous performance: Strongest post-pandemic recovery
United Kingdom
- Market share: 18% of global sales (2024)
- Sales value: $10.4 billion in 2024 (5% decline)
- Position: Reclaimed second place globally
China (Including Hong Kong)
- Market share: 15% of global sales (2024)
- Sales value: $8.4 billion in 2024 (31% decline)
- Performance: Sharpest drop since 2009
France
- Market share: 7% of global sales (2024)
- Sales value: $4.2 billion in 2024 (10% decline)
- Position: Fourth-largest market worldwide
Sources: Art Basel & UBS Global Art Market Report 2025
Art Market Price Segments by Transaction Volume
| Price Range | % of Transactions | % of Total Value | Market Trend |
|---|---|---|---|
| Under $5,000 | 67% | 8% | Growing ↗ |
| $5,000 – $50,000 | 28% | 24% | Stable ↗ |
| $50,000 – $250,000 | 4% | 18% | Mixed ↔ |
| $250,000 – $1M | 1% | 15% | Declining ↘ |
| Over $1M | <1% | 35% | Sharp Decline ↘ |
Source: Art Basel & UBS Global Art Market Report 2025
Auction House Statistics
Major Auction Houses Performance (2023)
- Sotheby’s revenue: Highest among fine art auction houses
- Christie’s global sales: ~$6 billion (26% decline from 2022)
- Sotheby’s global sales: Just under $8 billion (1.5% decline)
- Market concentration: 80%+ of works over $1 million sold by Christie’s and Sotheby’s
Auction Market Dynamics 2024
- Fine art works selling for $10+ million: 39% decline
- Total lots offered at auction: 1.2 million (historic high)
- Lots sold: 804,350
- Average lot price: $25,730
- Median lot price: $930
Sources: Statista, Artprice Annual Report 2024
Art Medium Preferences Among High-Net-Worth Collectors
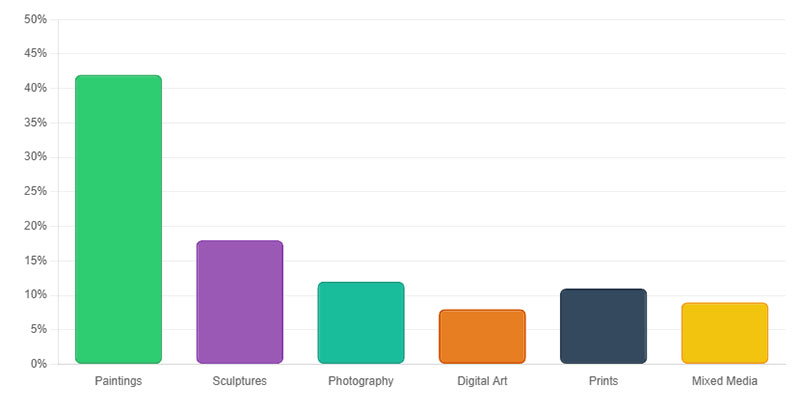
Traditional mediums still command the largest share of elite collections. Paintings dominate at 42% of HNW collections, while digital art represents emerging opportunities.
Medium Breakdown
- Paintings: 42% (strongest preference)
- Sculptures: 18% (growing trend for 2024)
- Photography: 12% (established medium)
- Prints: 11% (accessible collecting)
- Mixed Media: 9% (contemporary appeal)
- Digital Art: 8% (fastest growth potential)
Market Trends
Sculpture surge: Experts predict major growth in 2024 as collectors seek three-dimensional works.
Digital evolution: 8% current share expected to expand as NFTs and AI art gain legitimacy.
Texture emphasis: Physical mediums gain appeal as counter-response to digital saturation.
Sources: Art Basel & UBS Global Art Market Report 2025, Fact.MR Art and Sculpture Market Analysis, Contemporary Art Trend Reports
Art Collector Demographics by Age Group

Young collectors dominate the emerging art market landscape. 46% of art collectors are aged 18-39, representing the fastest-growing segment.
Key Findings
- Millennials and Gen Z: 46% of collector base
- Gen X collectors: 24% share
- Baby Boomers: 27% (still substantial but declining)
- Silent Generation: 3% (minimal presence)
Purchasing Behavior Differences
Younger collectors show distinct patterns:
- 78% very likely to buy art in next year
- Higher online spending allocation (42% spend 75%+ online)
- More risk-tolerant investment approach
Older collectors demonstrate:
- Only 34% likely to purchase next year
- Preference for traditional gallery channels
- Focus on aesthetic over investment value
Sources: Avant Arte Collector Report 2024, Bank of America Private Wealth Survey, Artsy Art Collector Insights
Gallery & Dealer Statistics
Gallery Market Performance
- Dealer sales decline 2024: 6% (more resilient than auctions)
- Small dealers (under $250k turnover): 17% growth in 2024
- Gallery profit margins: Only 18% achieve healthy 20%+ profit margins
- Loss-making galleries: 30% lose money annually
- Revenue distribution: 80% of galleries make under $200,000 annually
Gallery Demographics
- Total exhibiting artists globally: Just under 1 million
- Artists who exhibit in lifetime: Only 1 in 5 (20%)
- Geographic distribution: 34% of galleries in USA, 12% in Germany, 10% in UK
- Major gallery cities: New York (6%), London (5%), Berlin (4%), Paris (3%), LA (3%)
- Medium galleries: 65%+ of total galleries worldwide (2018 data)
Female Artist Representation
- Gallery representation of female artists: 41% in 2024 (up 6% from 2018)
- Women in top 10 artists under 40: Hold 8 positions
Sources: Art Basel & UBS Reports, Contemporary Art Issue, Artsy Gallery Report
Art Investment Performance Comparison 2024
| Asset Type | Annual Return (1995-2024) | 2024 Performance | Risk Level |
|---|---|---|---|
| Contemporary Art | 11.5% | -12% value decline | High |
| S&P 500 | 10.0% | +24% gains | Medium |
| Fine Art (Mei Moses) | 8.5% | -25% auction decline | High |
| Gold | 5.9% | +27% gains | Low |
| US Real Estate | 3.9% | +5% appreciation | Low-Medium |
Sources: Benzinga Market Research, Wall Street Zen, Art Basel & UBS Reports
Collector & HNWI Statistics
High Net Worth Individual Spending
- Median HNWI expenditure H1 2024: $25,555
- Mainland China HNWI spending: $97,000 (highest globally)
- HNWI optimism: 91% optimistic about market performance (up from 77% in 2023)
- Survey size: 3,660 HNWIs across 14 markets
Collector Behavior
- New gallery purchases: 88% of HNWIs bought from at least one new gallery
- Artist preference: 52% spent on new/emerging artists, 21% mid-career, 26% established
- Art fair importance: 31% of dealers identify fairs as top source for new buyers
Sources: Art Basel & UBS Survey of Global Collecting 2024
Major Art Fair Attendance & Performance 2024
| Art Fair | 2024 Attendance | Location | Market Status |
|---|---|---|---|
| ARCO Madrid | 100,000 | Madrid, Spain | Strong ↗ |
| Frieze London | 90,000 | London, UK | Record High ↗ |
| Art Basel Miami | 79,000 | Miami Beach, FL | Stable ↔ |
| TEFAF Maastricht | 50,000 | Netherlands | Luxury Focus ↗ |
| Taipei Dangdai | 35,000 | Taiwan | Asian Growth ↗ |
| Art Brussels | 26,000 | Brussels, Belgium | Boutique ↔ |
Sources: The Collector, ARTnews Fair Calendar, Artsy Art Fair Report 2024
NFT & Digital Art Statistics
NFT Market Performance
- NFT art sales 2023: $1.2 billion (51% decline from 2022)
- Peak NFT sales: $2.9 billion in 2021
- Growth from baseline: 60x larger than 2020 ($20 million)
- Collectibles segment 2023: $6.3 billion (64% decline)
- NFT integration: Increasing mainstream adoption without speculative excess
Sources: Art Basel & UBS Reports
Museum & Institution Statistics
Most Visited Art Museums 2023
- Louvre: Maintained top position globally
- National Gallery London: 3.1 million visitors (48% decline from 2019)
- National Portrait Gallery London: 1.2 million (31% increase in reopening months)
- Metropolitan Museum: 5.4 million visitors (with Met Cloisters)
- Fondation Louis Vuitton: 1.6 million (record year)
Museum Recovery Patterns
- Mixed recovery post-COVID
- Some institutions exceeded pre-pandemic numbers
- Tourism impact varies significantly by location
Sources: The Art Newspaper Annual Survey, Wikipedia
Auction Price & Performance Statistics
Price Performance Indicators
- Auction prices vs estimates 2024: Only 1% above mid-estimates (lowest in 7 years)
- Lots selling below low estimates: 32% in May 2024 auctions
- Resale annual returns: 4.6% (lowest in 5+ seasons)
- Emerging art cooling: Sotheby’s “The Now” sales down 55% since 2022
Market Confidence
- ArtTactic Confidence Indicator 2024: 38 (first half), 22 (second half)
- Historical context: Lowest since pandemic lows
- Dealer outlook 2025: 80% expect stable (47%) or improved (33%) sales
Sources: Bank of America Art Market Updates, ArtTactic
Art Fair & Event Statistics
Art Fair Performance
- Art fairs as dealer priority: 31% cite as main new buyer source
- Fair importance: Increased 1% from 2023
- Transaction growth: Art fair sales increased despite market decline
- Global reach: Fairs maintain significance for international sales
Sources: Art Basel & UBS Reports
Investment & Financial Statistics
Art as Investment
- Global art auction turnover H1 2024: Lowest since pandemic
- Artwork investment appeal: Enduring despite market challenges
- Price adjustments: Significant corrections in high-end segments
- Market accessibility: Lower prices create new entry opportunities
Cross-Border Trade
- Art imports 2022: $30.7 billion (highest ever)
- Art exports 2022: $33.4 billion (second highest)
- International trade: Robust despite regional market variations
Sources: Various Art Market Reports
Industry Employment & Business Statistics
Art Dealer Industry (US)
- Business count 2022-2024: Steady operation levels
- Geographic concentration: Major metros dominate
- Market challenges: Rising costs, competition, limited profitable segments
Technology Integration
- AI adoption: Increasing across creation, valuation, and marketing
- Blockchain usage: Growing for provenance and smart contracts
- Digital transformation: Permanent shift in business models
Sources: Statista, Various Industry Reports
Note: Statistics compiled from leading art market research sources including Art Basel & UBS Reports, Artprice, Statista, ArtTactic, and major auction house publications. Data represents most current available figures as of 2024-2025.
Conclusion
These art statistics paint a picture of an industry in transformation, where traditional powerhouses like Christie’s compete alongside digital platforms revolutionizing access to cultural data. The numbers don’t lie: from declining auction results at the high end to surging transaction volumes in affordable segments.
Market research from institutions like Arts Economics reveals critical shifts in demographic studies and cultural participation. Young collectors dominate online channels while museum visitor data shows record attendance at major exhibitions.
Key takeaways include:
- Gallery turnover figures highlight resilience among smaller dealers
- Art investment metrics outperformed traditional assets historically
- Cultural sector statistics show expanding global collector base
- Market intelligence points to continued digital transformation
The art economy indicators suggest a market becoming more accessible and diverse. While price indices may fluctuate, the fundamental appeal of art as both cultural expression and market valuation opportunity remains stronger than ever.
Understanding these performance indicators empowers collectors, investors, and cultural institutions to make informed decisions in an evolving landscape.